How to Conduct a Core Web Vitals Audit and Fix Issues That Kill Rankings
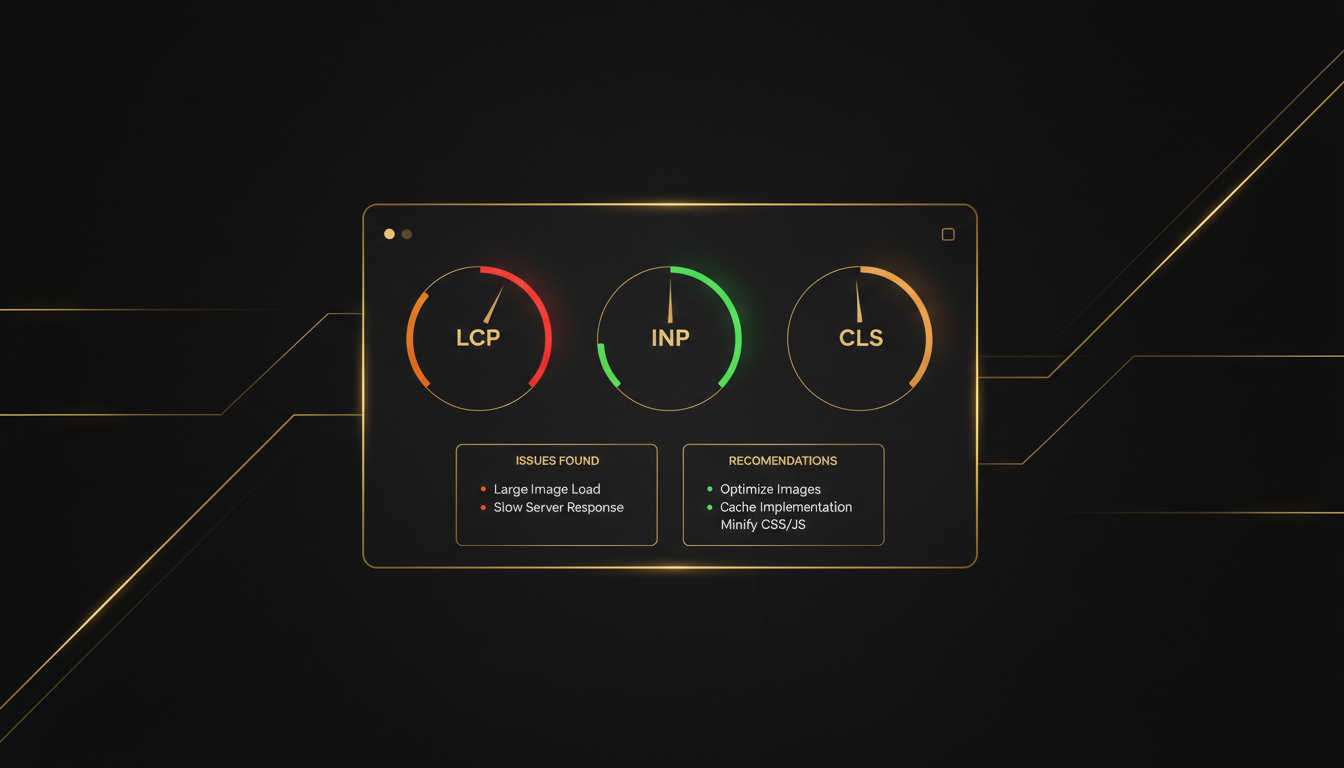
A core web vitals audit is one of the highest-leverage technical SEO tasks you can run, because the three metrics Google measures — LCP, INP, and CLS — directly influence your Page Experience ranking signal. If any of them fall into the "Poor" or "Needs Improvement" range, you are leaving ranking potential on the table regardless of how strong your content or backlinks are. This guide walks through exactly how to audit all three, interpret the data sources correctly, and prioritize fixes that move the needle.
Quick answer: A core web vitals audit starts with Google Search Console's Core Web Vitals report to identify failing URLs using real-user CrUX data, then drills into PageSpeed Insights or Lighthouse for page-level diagnostics. The three metrics to fix are Largest Contentful Paint (LCP, target ≤ 2.5 s), Interaction to Next Paint (INP, target ≤ 200 ms), and Cumulative Layout Shift (CLS, target ≤ 0.1). For site-wide coverage, a technical SEO audit tool that crawls all URLs and surfaces failing pages in bulk is far more efficient than checking pages one at a time. After deploying fixes, CrUX data updates on a 28-day rolling window, so expect ranking changes within four to eight weeks.
Why Core Web Vitals Still Matter as a Ranking Signal
Google's Page Experience ranking signal bundles Core Web Vitals with HTTPS and mobile-friendliness. While content quality remains the dominant ranking factor — as the Google helpful content guidance makes clear — Core Web Vitals act as a tiebreaker between pages of comparable relevance. In competitive niches, that tiebreaker is the difference between position 4 and position 1.
More importantly, the metrics reflect genuine user experience. A slow LCP means visitors wait for the page to feel loaded. A high INP means clicks and taps feel laggy. A poor CLS means content jumps around and users tap the wrong element. Google is measuring what users actually feel, not a synthetic proxy.
The Three Metrics at a Glance
| Metric | What It Measures | Good Threshold | Poor Threshold |
|---|---|---|---|
| Largest Contentful Paint (LCP) | Time until the largest visible element renders | ≤ 2.5 s | > 4.0 s |
| Interaction to Next Paint (INP) | Latency of all user interactions | ≤ 200 ms | > 500 ms |
| Cumulative Layout Shift (CLS) | Visual stability — unexpected layout movement | ≤ 0.1 | > 0.25 |
INP replaced First Input Delay (FID) in March 2024. Unlike FID, which only measured the first interaction, INP captures every click, tap, and keyboard input throughout the page session, making it a far more honest measure of responsiveness.
How to Run a Core Web Vitals Audit: Step by Step
Step 1 — Start with Google Search Console for Real-User Data
The Chrome User Experience Report (CrUX) aggregates anonymized field data from real Chrome users. Google Search Console surfaces this data in its Core Web Vitals report, segmented by mobile and desktop, and grouped into URL clusters. This is your ground truth — lab tools like Lighthouse measure a simulated load, but CrUX reflects what actual visitors experienced over the past 28 days.
Open Search Console → Experience → Core Web Vitals. Export the "Poor" and "Needs Improvement" URL groups. These are your audit targets. If a URL cluster has fewer than a threshold of real-user sessions, Google won't show it here — that's when lab tools become your fallback.
Step 2 — Use PageSpeed Insights for Page-Level Diagnostics
Google PageSpeed Insights combines CrUX field data with a Lighthouse lab run in a single report. For each failing URL from Step 1, run it through PageSpeed Insights to see:
- Which element is the LCP element (usually a hero image, large text block, or video poster)
- What is delaying LCP (render-blocking resources, slow server response, lazy-loaded images above the fold)
- Which interactions are driving INP (heavy JavaScript event handlers, long tasks blocking the main thread)
- What is causing CLS (images without explicit dimensions, dynamically injected content, web fonts causing FOIT/FOUT)
The "Opportunities" and "Diagnostics" sections give you actionable fix recommendations ranked by estimated impact.
Step 3 — Scale to the Full Site with a Technical Audit Tool
Checking pages one by one in PageSpeed Insights is impractical for sites with hundreds or thousands of URLs. A dedicated SEO audit tool can crawl your entire site, flag every URL with Core Web Vitals issues, and group them by issue type so you can batch-fix similar problems. This is especially critical for agencies managing multiple client sites — manual auditing at scale is not a repeatable workflow.
For a deeper look at how AI-assisted tooling changes the efficiency of this process, see the guide on how to use AI for technical SEO audits.
Fixing the Most Common Core Web Vitals Issues
LCP Fixes: The Fastest Wins
The LCP element is almost always one of three things: a hero image, a large heading rendered in a web font, or a video poster frame. Identify it in PageSpeed Insights, then apply the relevant fix:
- Hero images: Serve in WebP or AVIF format, add
fetchpriority="high"to the<img>tag, and removeloading="lazy"from above-the-fold images. Lazy loading an LCP image is one of the most common self-inflicted LCP penalties. - Slow server response (TTFB): LCP cannot be fast if the server is slow. Improve Time to First Byte through caching, a CDN, or server-side rendering. A TTFB above 600 ms will almost always push LCP into "Needs Improvement."
- Render-blocking resources: CSS and synchronous JavaScript that load before the LCP element delay its render. Inline critical CSS, defer non-critical scripts, and preload the LCP resource using
<link rel="preload">.
INP Fixes: Taming JavaScript
INP is almost always a JavaScript problem. Long tasks on the main thread — anything over 50 ms — block the browser from responding to user input. Common causes include:
- Large JavaScript bundles executing on interaction
- Synchronous third-party scripts (chat widgets, tag managers, analytics)
- Inefficient event handlers that trigger expensive DOM operations
Fix strategies include code splitting, deferring third-party scripts until after the page is interactive, and using scheduler.postTask() or requestIdleCallback() to yield to the browser during long tasks.
CLS Fixes: Locking Down Layout
CLS is the most fixable of the three metrics because the causes are usually structural:
- Always set explicit
widthandheightattributes on images and video embeds so the browser reserves space before they load. - Avoid inserting content above existing content after the page loads (banners, cookie notices, ad slots).
- Use
font-display: optionalor preload web fonts to prevent layout shifts caused by font swaps. - Reserve space for ad slots with
min-heightCSS even when no ad fills the slot.
What Matters Most: Audit Prioritization Framework
When you have a list of failing URLs, use this framework to decide what to fix first:
- High traffic + Poor score: Fix immediately. These pages are losing ranking potential on your most visited content.
- High traffic + Needs Improvement: Fix next. Small gains here have the largest organic impact.
- Low traffic + Poor score: Fix in a batch. Template-level fixes (image dimensions, font loading) often resolve these at scale.
- Low traffic + Needs Improvement: Monitor. Deprioritize unless the page is a conversion target.
For agencies, this prioritization logic belongs in every client report. The guide on how to build client-ready SEO reports executives read covers how to frame technical findings in business terms.
Monitoring After Fixes Are Deployed
CrUX data updates on a 28-day rolling window. This means you will not see Search Console's Core Web Vitals report improve immediately after deploying fixes — the old user sessions are still in the window. Check Search Console weekly starting two weeks after deployment. If the fix was effective, you will see the "Poor" URL count decline and "Good" URL count rise over the following four to six weeks.
For ongoing monitoring, integrate Core Web Vitals tracking into your regular AI SEO workflow for agencies so regressions are caught before they compound. A single new third-party script or an unoptimized image in a CMS template can silently push a previously passing page back into "Poor."
For a broader comparison of tools that surface Core Web Vitals data alongside other technical signals, see best SEO audit tools compared.
Frequently Asked Questions
What are Core Web Vitals and why do they affect Google rankings?
Core Web Vitals are three page experience metrics Google uses as ranking signals: Largest Contentful Paint (LCP) measures loading speed, Interaction to Next Paint (INP) measures responsiveness, and Cumulative Layout Shift (CLS) measures visual stability. Pages that pass all three thresholds receive a positive ranking signal in Google Search.
How do I run a Core Web Vitals audit on my website?
Start with Google Search Console's Core Web Vitals report for real-user CrUX data, then use PageSpeed Insights or Lighthouse for page-level diagnostics. For site-wide audits, a technical SEO audit tool can crawl all URLs and surface failing pages in bulk, which is especially useful for large sites or agency clients.
What is a good LCP score for SEO?
Google considers an LCP of 2.5 seconds or faster as 'Good.' Between 2.5 and 4.0 seconds is 'Needs Improvement,' and anything above 4.0 seconds is 'Poor.' The LCP element is typically the hero image, a large text block, or a video poster — optimizing whichever element renders last is the fastest path to improvement.
What replaced First Input Delay (FID) in Core Web Vitals?
Google replaced First Input Delay (FID) with Interaction to Next Paint (INP) in March 2024. INP measures the latency of all interactions on a page — not just the first — making it a more comprehensive measure of real-world responsiveness. A Good INP score is 200 milliseconds or less.
How long does it take to see ranking improvements after fixing Core Web Vitals?
Google's CrUX data updates on a 28-day rolling window, so ranking improvements typically become visible within four to eight weeks after fixes are deployed and real-user data reflects the changes. Monitoring Google Search Console's Core Web Vitals report weekly after deployment is the most reliable way to confirm progress.
Sources and Further Reading
Your next step: Open Google Search Console right now, navigate to Experience → Core Web Vitals, and export your "Poor" URLs for mobile. That list is your audit backlog. If it contains more than twenty URLs, a site-wide technical audit tool will save you hours — run one this week and prioritize by traffic before your competitors do.
← All posts